

Greenhouse Gas Emissions Inventories
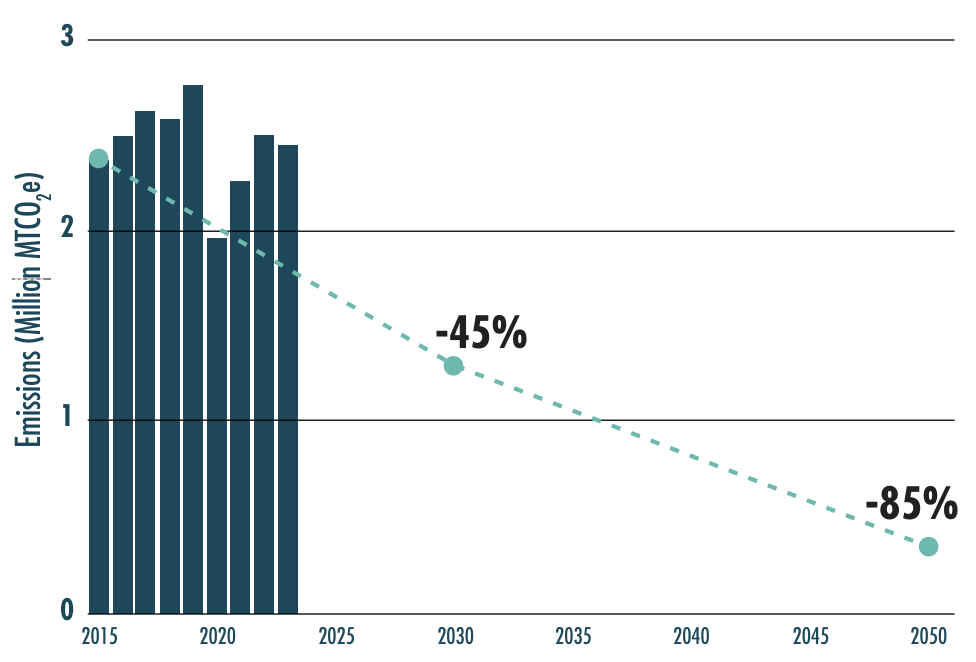
The Thurston Climate Mitigation Plan (TCMP) includes the targets of reducing greenhouse gas (GHG) emissions 45% by 2030 and 85% by 2050, relative to a 2015 baseline. The TCMP’s monitoring framework recommends GHG inventories as one way to gauge accountability and track progress toward achieving these targets.
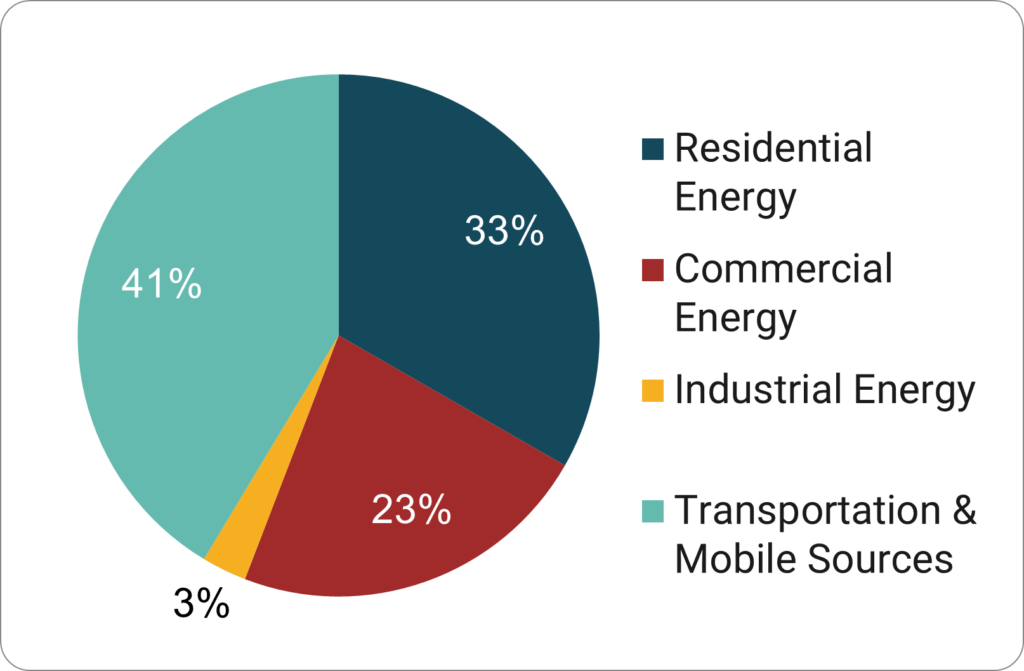
TCMC partners completed annual communitywide GHG inventories for Thurston County from 2010 to 2022. Starting in 2023, the TCMC now follows a “dash-dash-full” GHGI schedule, in which “dash” inventories are conducted most years, with full GHG inventories every three years. A dash inventory includes emissions from buildings and on-road transportation, which together account for about 90% of the county’s emissions.

Thurston County 2023 Dash GHG Inventory Results
The 2023 dash inventory estimates the region’s GHG emissions from buildings and on-road transportation at 2.45 million metric tons of CO2e (MTCO2e).
Thurston County 2022 Greenhouse Gas Inventory Results
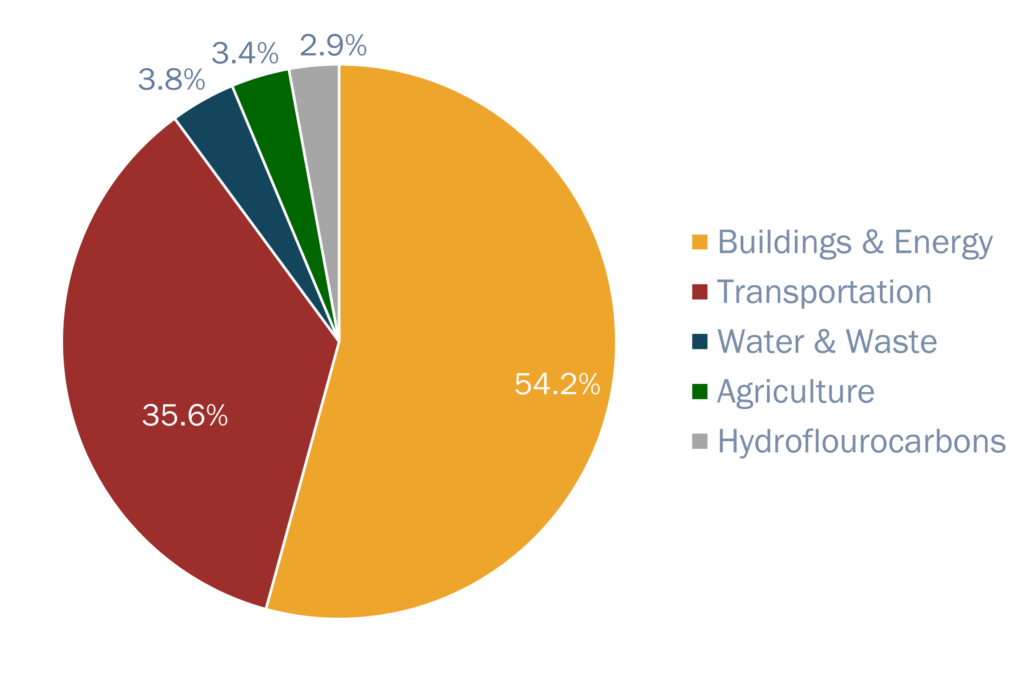
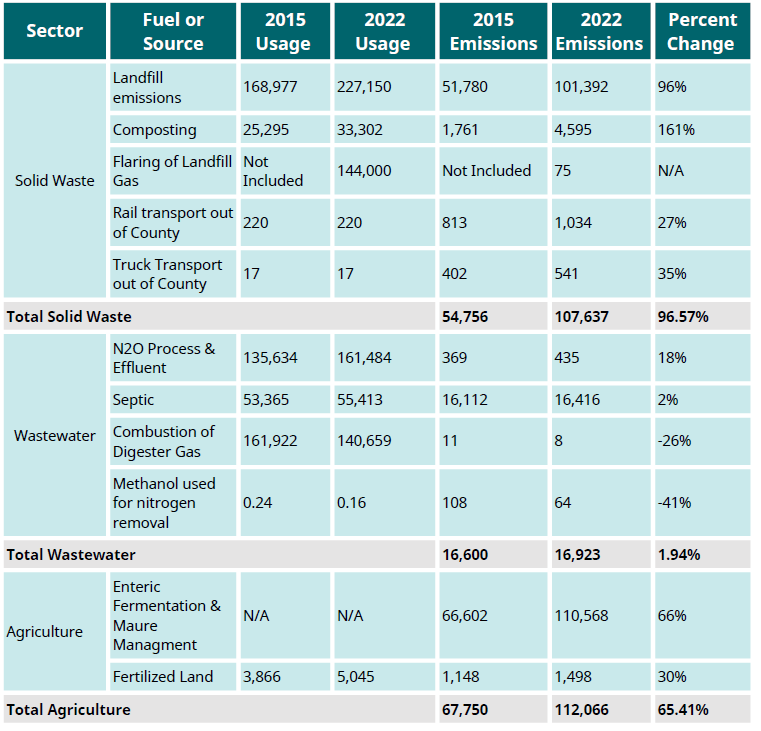
Total 2022 GHG emissions in Thurston County are estimated at 3.26 million metric tons of carbon dioxide equivalent (MTCO2e). The overall breakdown is similar to prior years, with Buildings and Energy accounting for 54% of emissions and the Transportation Sector accounting for 36%. The other sectors are Agriculture (3%), Fugitive Emissions (3%), Solid Waste (3%), and Wastewater (1%).
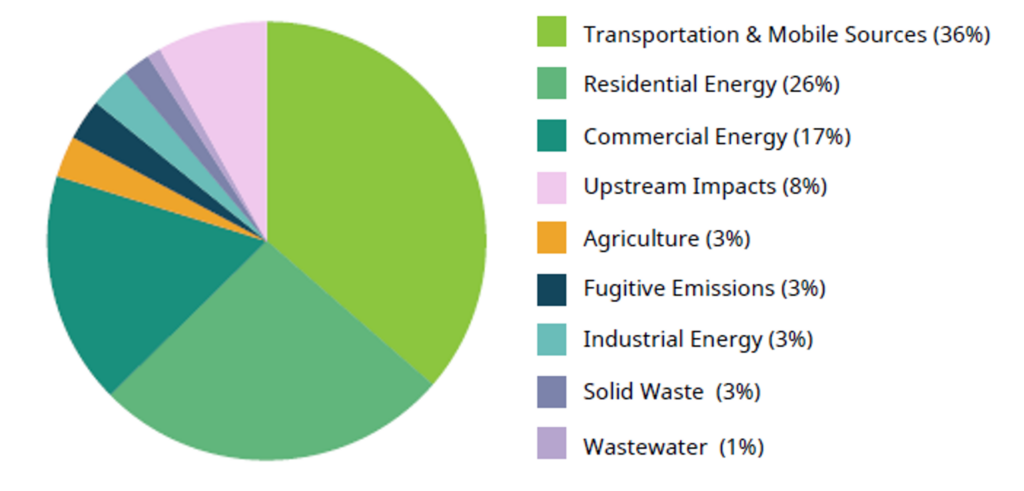
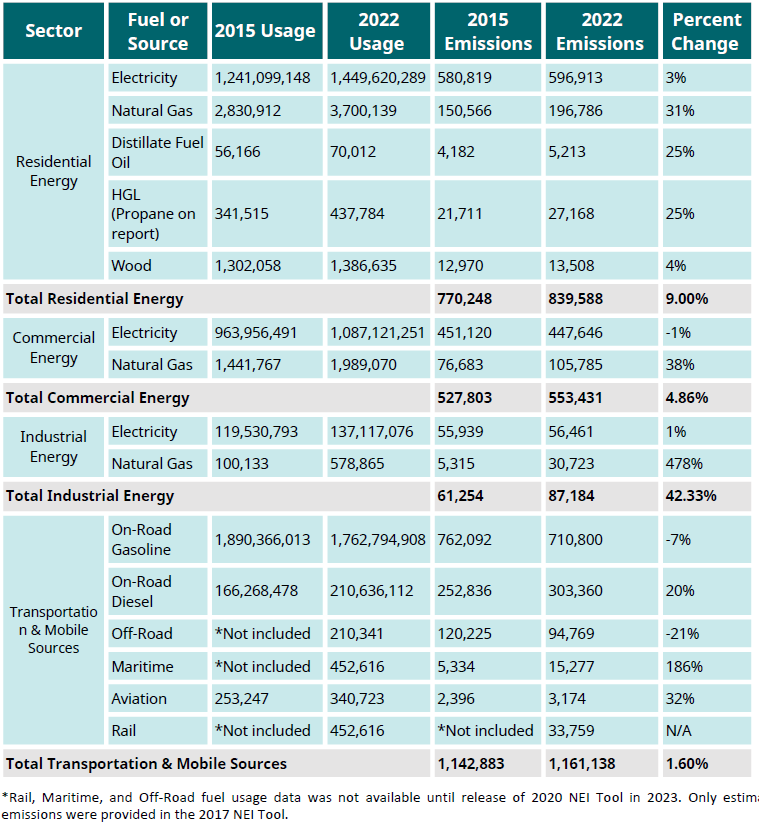
The report breaks down Thurston County’s emissions into more detailed sectors as shown below. This breakdown shows the top three sectors as Transportation & Mobile Sources (36%), Residential Energy (26%), and Commercial Energy (17%).
Thurston County "Dash" GHG Inventory (2015-2023)
Thurston County’s GHG emissions from buildings and on-road transportation were 1.7% lower than emissions in these two sectors in 2022, and 3.3% higher than the 2015 baseline.
Per capita emissions from buildings and on-road transportation decreased by 7.4% compared to 2015.
Thurston County Full GHG Emission Inventory (2015-2022)
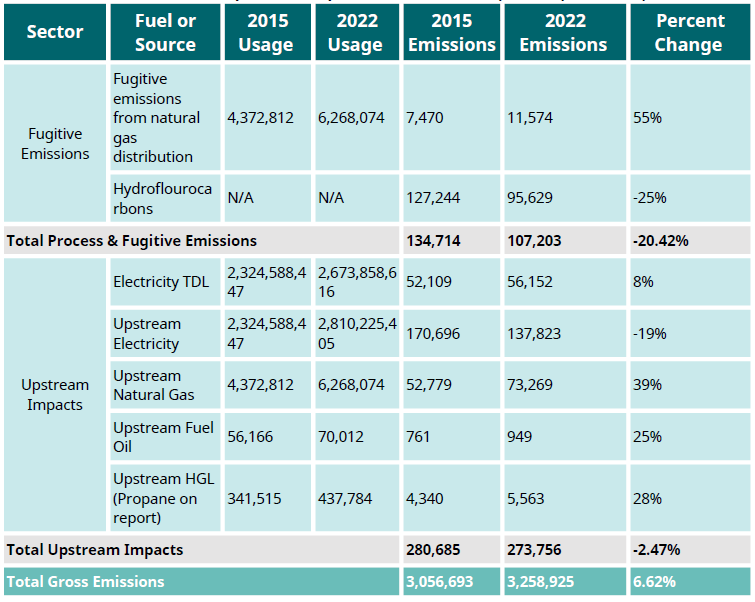
Thurston County’s total GHG emissions increased by approximately 6.6% from 2015 to 2022. Emissions increased 13% from 2015 to 2019, dropped more than 18% from 2019 to 2020 (largely as a result of decreasing transportation emissions during the pandemic), then increased 16% from 2020 to 2022.
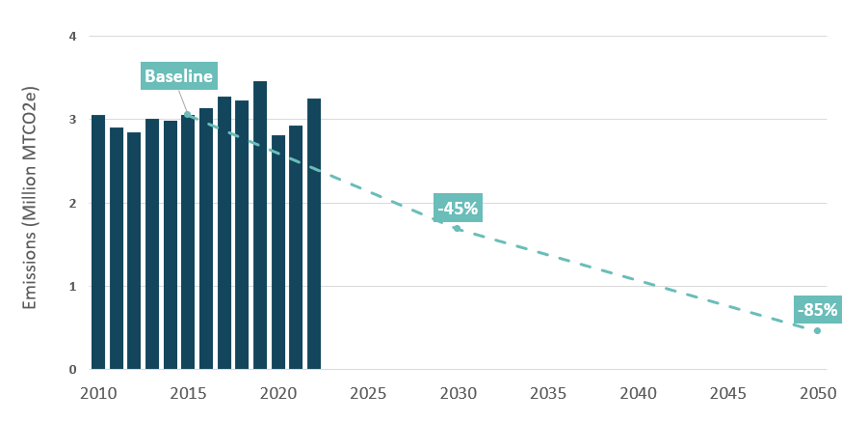
Thurston County GHG Inventory Comparison 2015 to 2022
Prior GHG Inventory Report
2021 Greenhouse Gas Inventory for Thurston County
Additional Data
For more regional data about emissions, energy use, transportation and land use trends, waste production, and more, including downloadable data tables, visit TRPC’s Climate Change Data page.